Eye-Tracking Metropolitan Museum of Art website
Creating a Streamline Navigation for Planning/Ticket Purchase Experience
Creating a Streamline Navigation for Planning/Ticket Purchase Experience
Download:
[ see full presentation ]
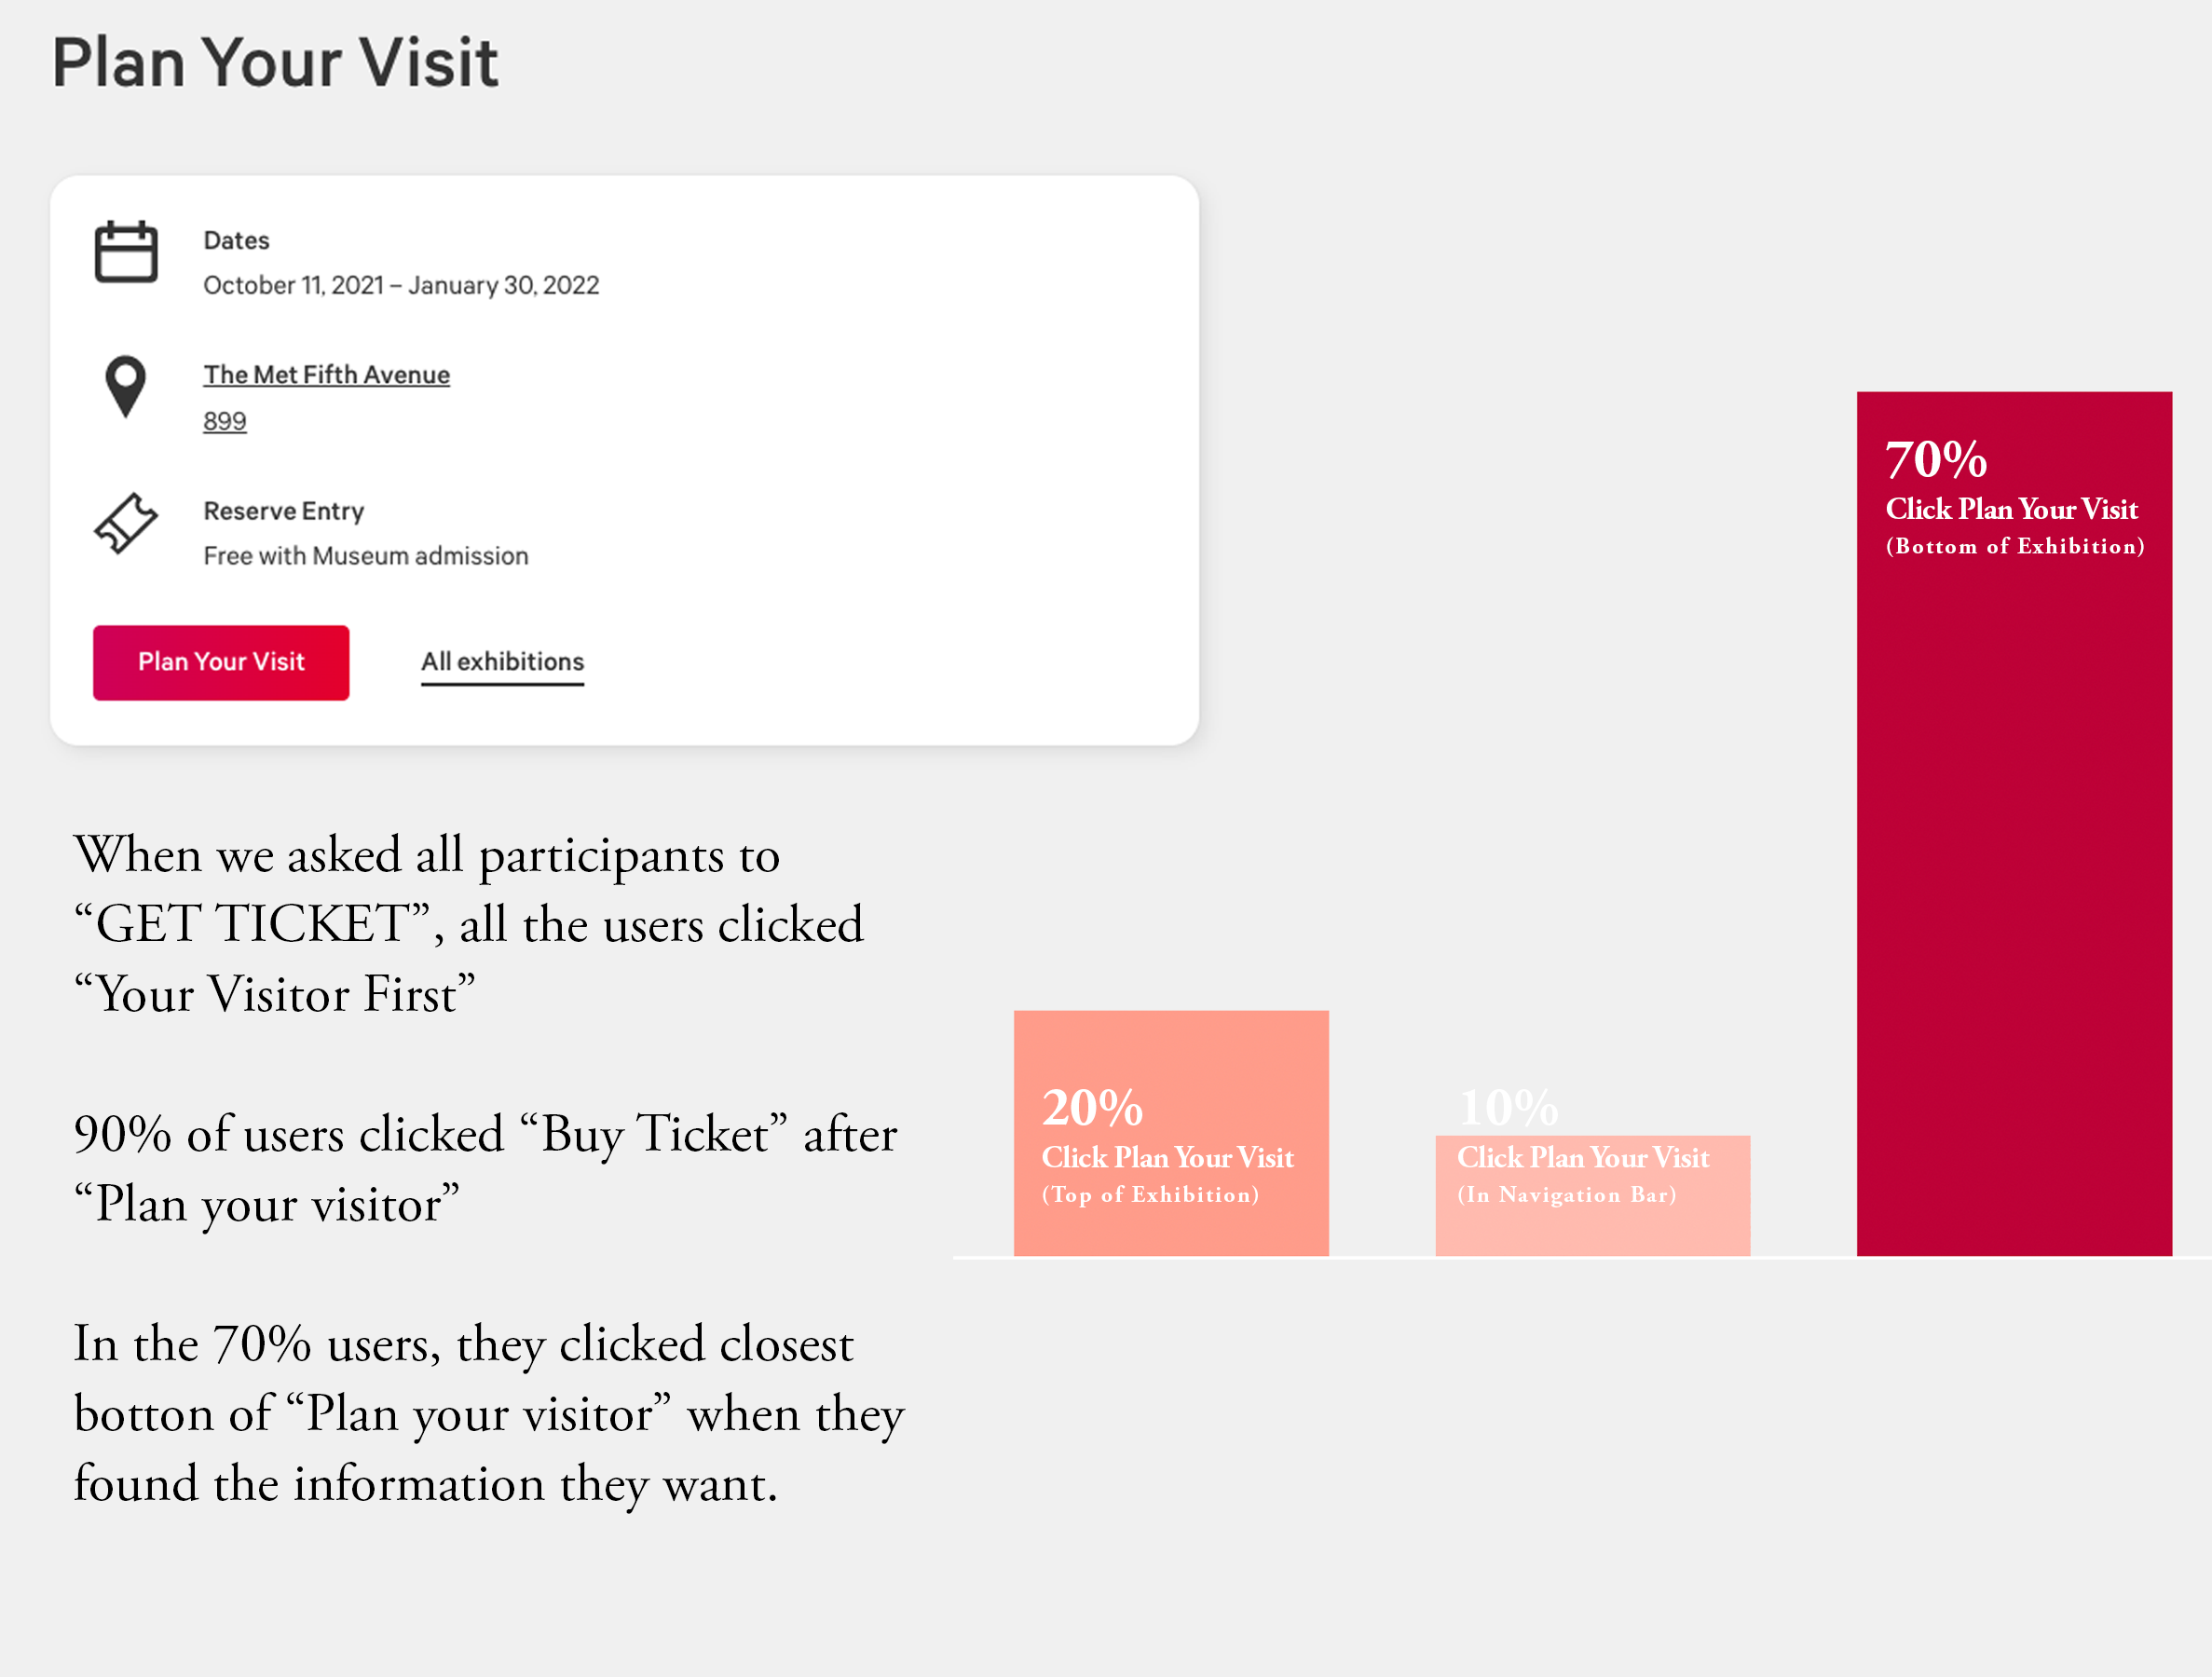
Amidst the challenges posed by the pandemic over the past year, institutions have undertaken website updates to improve their online ticket booking systems, effectively managing museum capacity. The Metropolitan Museum of Art (MET), a globally renowned institution, seeks to understand how visitors navigate the planning process for their visit, their information preferences, and the ticket reservation process. Our focus aligns with these objectives, and we have gathered valuable insights accordingly.

Overview
This project was a teamwork effort. We collaborated to set up our research plan, which included a Screener, Recruitment of Participants, Consent Form, Interview Schedule, Disclaimer, Tasks (including during and post-task questions), Real-Time Analysis (RTA), and Presentation. In order to discover how this experience could be delivered more effectively, satisfactorily, and efficiently, we conducted eye-tracking using the TOBII tool to study, analyze, and understand participants' behaviors in order to achieve our goals:
This project was a teamwork effort. We collaborated to set up our research plan, which included a Screener, Recruitment of Participants, Consent Form, Interview Schedule, Disclaimer, Tasks (including during and post-task questions), Real-Time Analysis (RTA), and Presentation. In order to discover how this experience could be delivered more effectively, satisfactorily, and efficiently, we conducted eye-tracking using the TOBII tool to study, analyze, and understand participants' behaviors in order to achieve our goals:-
What information users seek out?
- Areas of friction when purchasing a ticket or reserving a time to visit?
- How users navigate the site to plan their visit?
Team Member Aimee S
Aimee S
Amiya D
Danielle K
Alyssa B
Victor C
Tools
Tobii
Tobii
Miro
Tableau
Tasks and Recruitment Interviews to Provide More Insights.
Our client wanted this research to focus on their homepage, 'Plan Your Visit,' and 'Buy Tickets' system for the target group: international visitors, non-English speakers, and students. Our task was to create a simple and comfortable atmosphere to make them feel at ease, as if they were engaging in their usual behavior. In order to collect more spontaneous data, we asked users to browse the website without speaking aloud. Once the task was finished, users went through the entire eye tracker recording using TOBII and clicked on certain points of the video recording, then asked the participant why they clicked where they did.

The overview of participant SUS statistics shows that users felt satisfied with the ticket system. Additionally, through quantitative data from TOBII, we used Areas of Interest (AOI), Time of Interest (TOI), Heatmaps, Duration of TOI, and Click data for Events to determine what is working well and what needs improvement.
We have still found some improvements in the areas we have studied.